100 uHz to 4.5 mHz for the earthquake plots here.
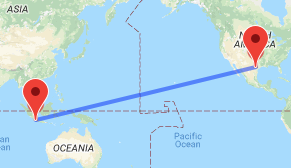
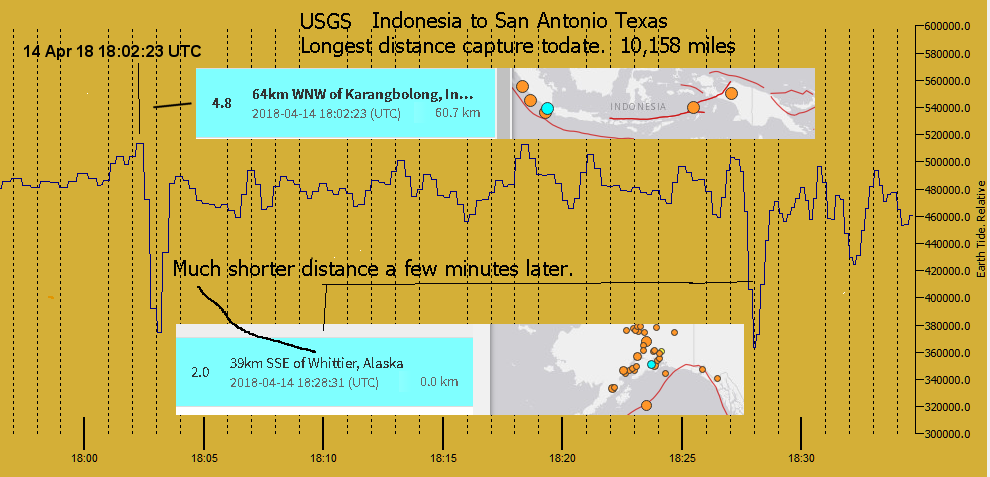
System Range: > 10,000 miles so far.
|
Latest Earth Signals Experiments 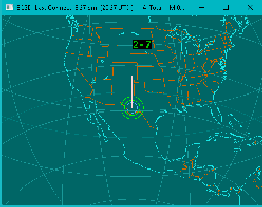 Texas Earthquake Recorded See adjacent ----> 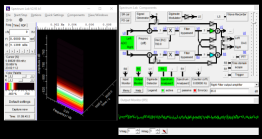 Earth Free Oscillations Reception Experiment. >>> 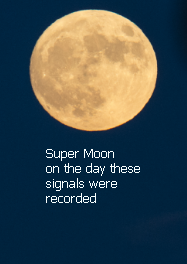 _______________________________ Earthquakes Detected on Earth Tides  Earthquake detected by Earth Tide Signal. >> Near Panama Quake detected record. >> Example Earth Tide / Earthquake Signals >>>  Moon phase signal examples >>> Future demo's for operating programs. Under construction Demo page. >> Find Earthquakes RealTime USGS Browser real time map >>> Download page for Earth Tide and Earthquake Records (Just unzip and view in windows or other media viewer.) >>> From Previous lrsatx.com Site Flat Panel TOA Lightning Antenna >>> DIY Ferrite Ant. (Original design by Don Froula IL.) >>> Blitzortung TOA >>> |
Since few people understand where these signals come from, here is link to a great discussion by an expert in the field. Earths Many Voices a Unified Theory for Pre-Earthquake Signals - YouTube Other research explained by Dr. Freund Living with a Star, Dangerously - Friedemann Freund - YouTube
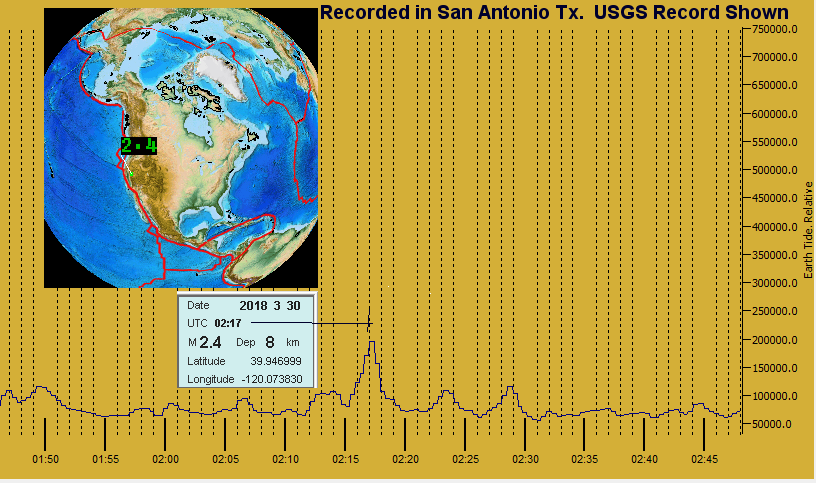
Note: This shows on our computers when the computer is locked to GPS. Important for signal timing.
System Overview
______________________________ Current Projects 1- Reception of the 7.8 Hz Schumann earth cavity signals. 2- Earth Tide 0.00001 to 0 0001 Hz. Part of the latest on going projects below 1 Hz. 3-Earthquake detection using the power grid for electrical reception instead of mechanical detection of waves. No surface wave delay! Latest capture Sample Earthquakes captured. Just random loggings Charts are based on the USGS government site.
Hawaii on 04 May 2018. Massive M 6.9 Earthquake as seen by the system.
Longest distance to date 14 Apr 2018
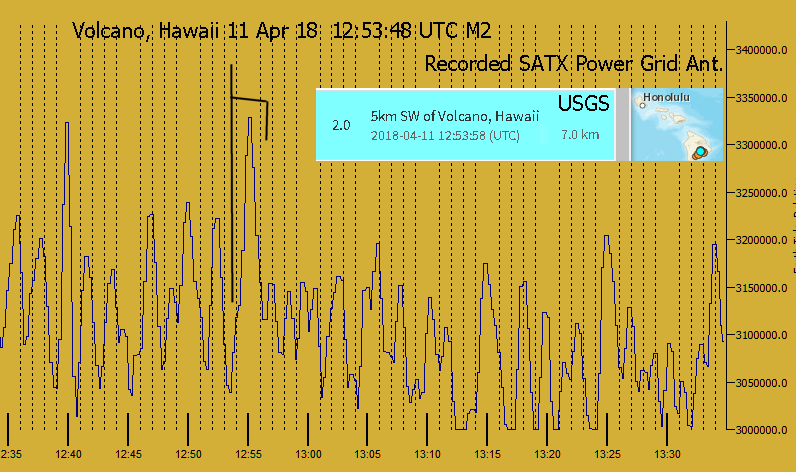
Activity near Volcano in Hawaii. Note: Unlike normal instruments this system has very little delay to reach the power grid and register on the plot. < than 200 mSec for the longest path. About the same as Schumann lightning reception.
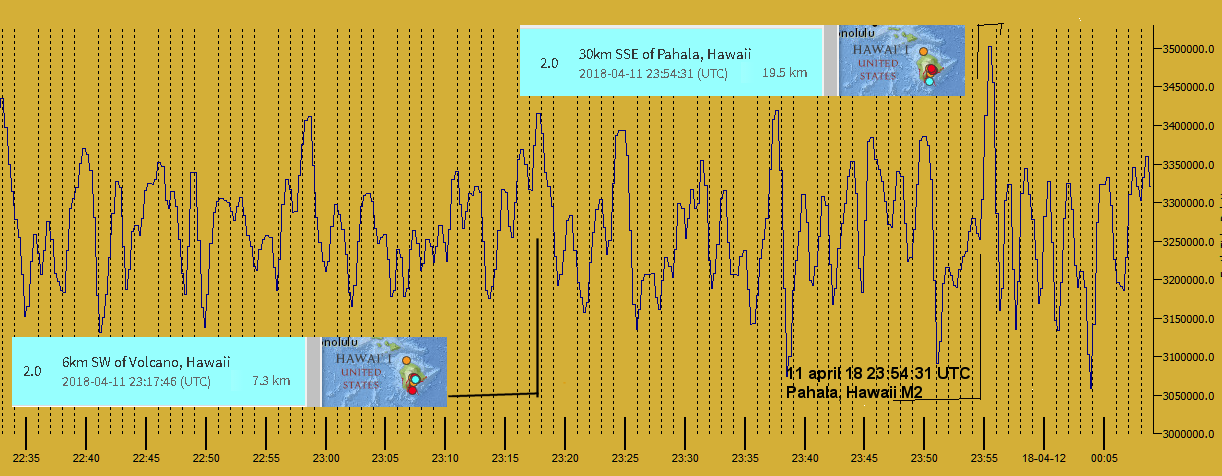
More volcano activity. Minutes apart in the same general area.
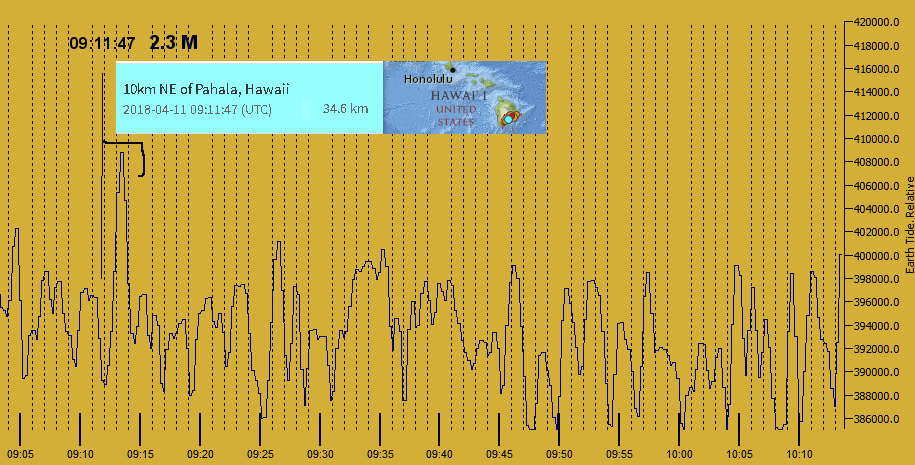
Hawaii 2.3 M
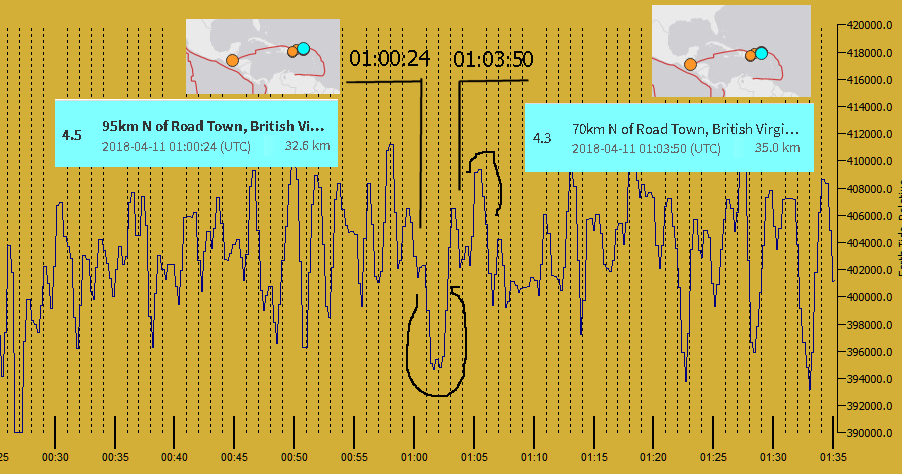
Twin
Earthquakes minutes apart
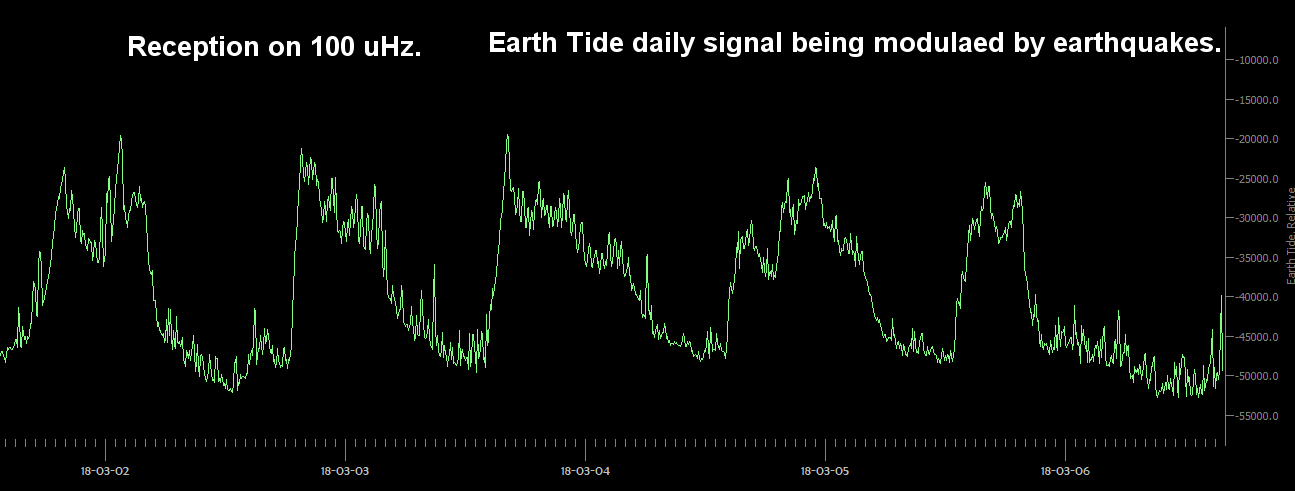
____________________________________________________________________________ Below are some snaps of the on going research into the Earth Tide signals. 0.00001 to 0.0001 Hz. After the full moon, signals do a massive return. Daily repeating Sun and Moon tide signals as shown below. 1800 Hr. on the chart is 12 noon local time. About 3 hours level transition time from high to low or low to high.
The signals below have been slowed down on the plot. This gives several days activity on the same plot. For seeing the earthquakes just the opposite is needed. Since the earthquakes are ridding the Earth Tide, it makes it a more difficult task to chart them. It is a slow chase to keep things on the plot when chasing the earthquakes. Needed is a way to separate these two different activities. Here is 4 days of Earth Tide signals being modulated by daily earthquakes. That is the spikes you see on the larger Earth Tide signal. The large signal changes as the 28 day moon cycle goes around the earth. The sun is a smaller modulation on the Earth Tide signal. The earth's daily rotation modulates the large wave.
|
|||
|
Schumann Projects More here later as the lightning season changes. Blitzortung TOA >>>
Super Globe Weather RemoteSPSM Prg. >>>
Contact Email
|
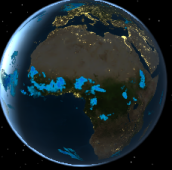
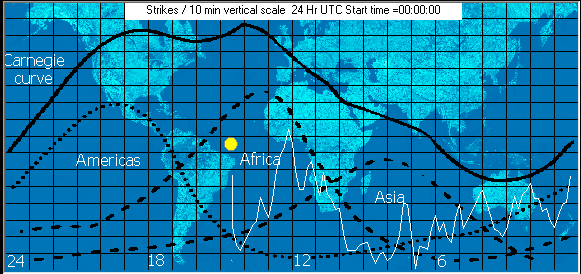
Schumann Cavity Lightning background Received on 7.8 Hz via Power Grid 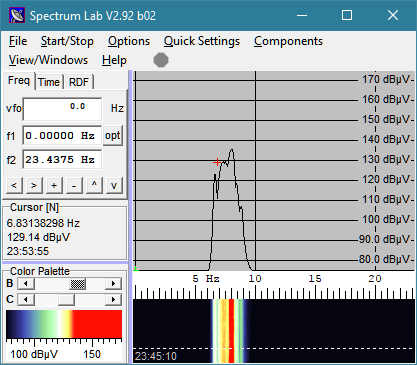 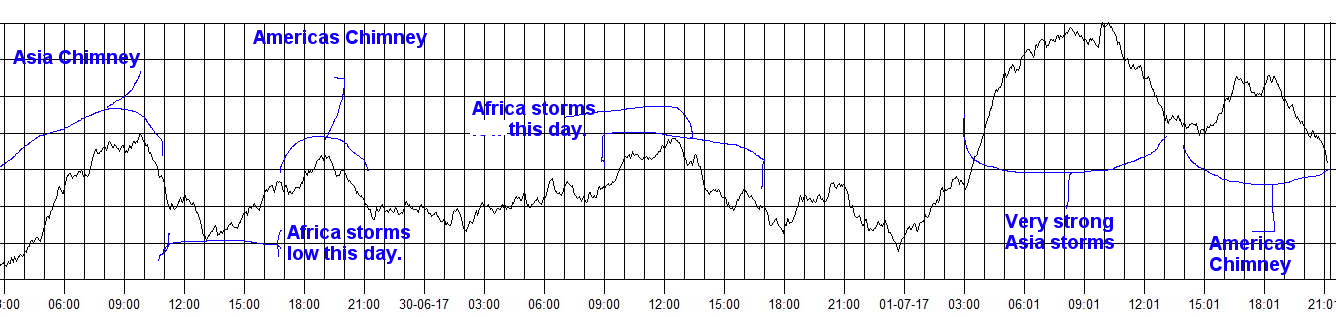
Schumann Cavity Lightning Plotting
Example
 Looking for Q burst above the Schumann background level. Recorded during the African Chimney time. 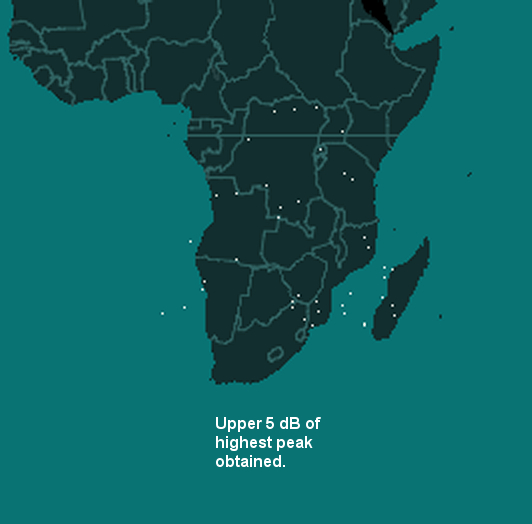 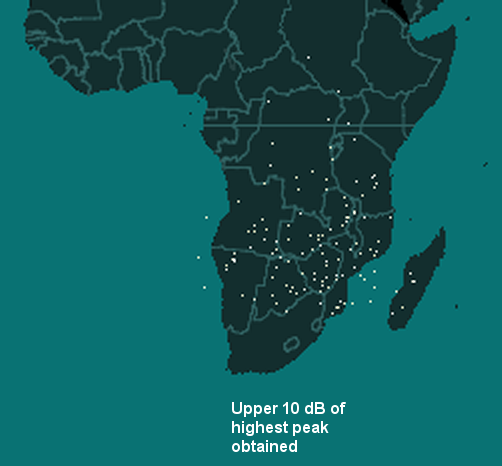
UTC Time |
|||
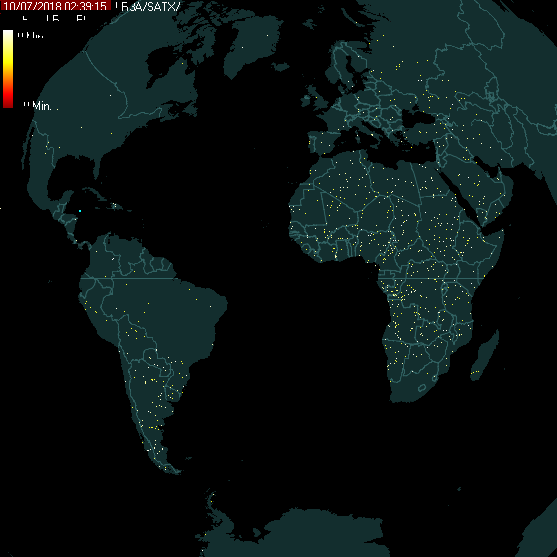
 7.8Hz signals generated by storms like that shown above. Obtained by a special program written for this experiment |